
Your offshore construction site, live — and its finish date, forecast.
Pharos turns day-to-day construction data into one clear picture: where every foundation, cable and turbine stands today, and when the campaign is projected to finish. Built for offshore wind construction teams.
Access to the platform is by invitation — Pharos runs at pharos.kappontos.fr.
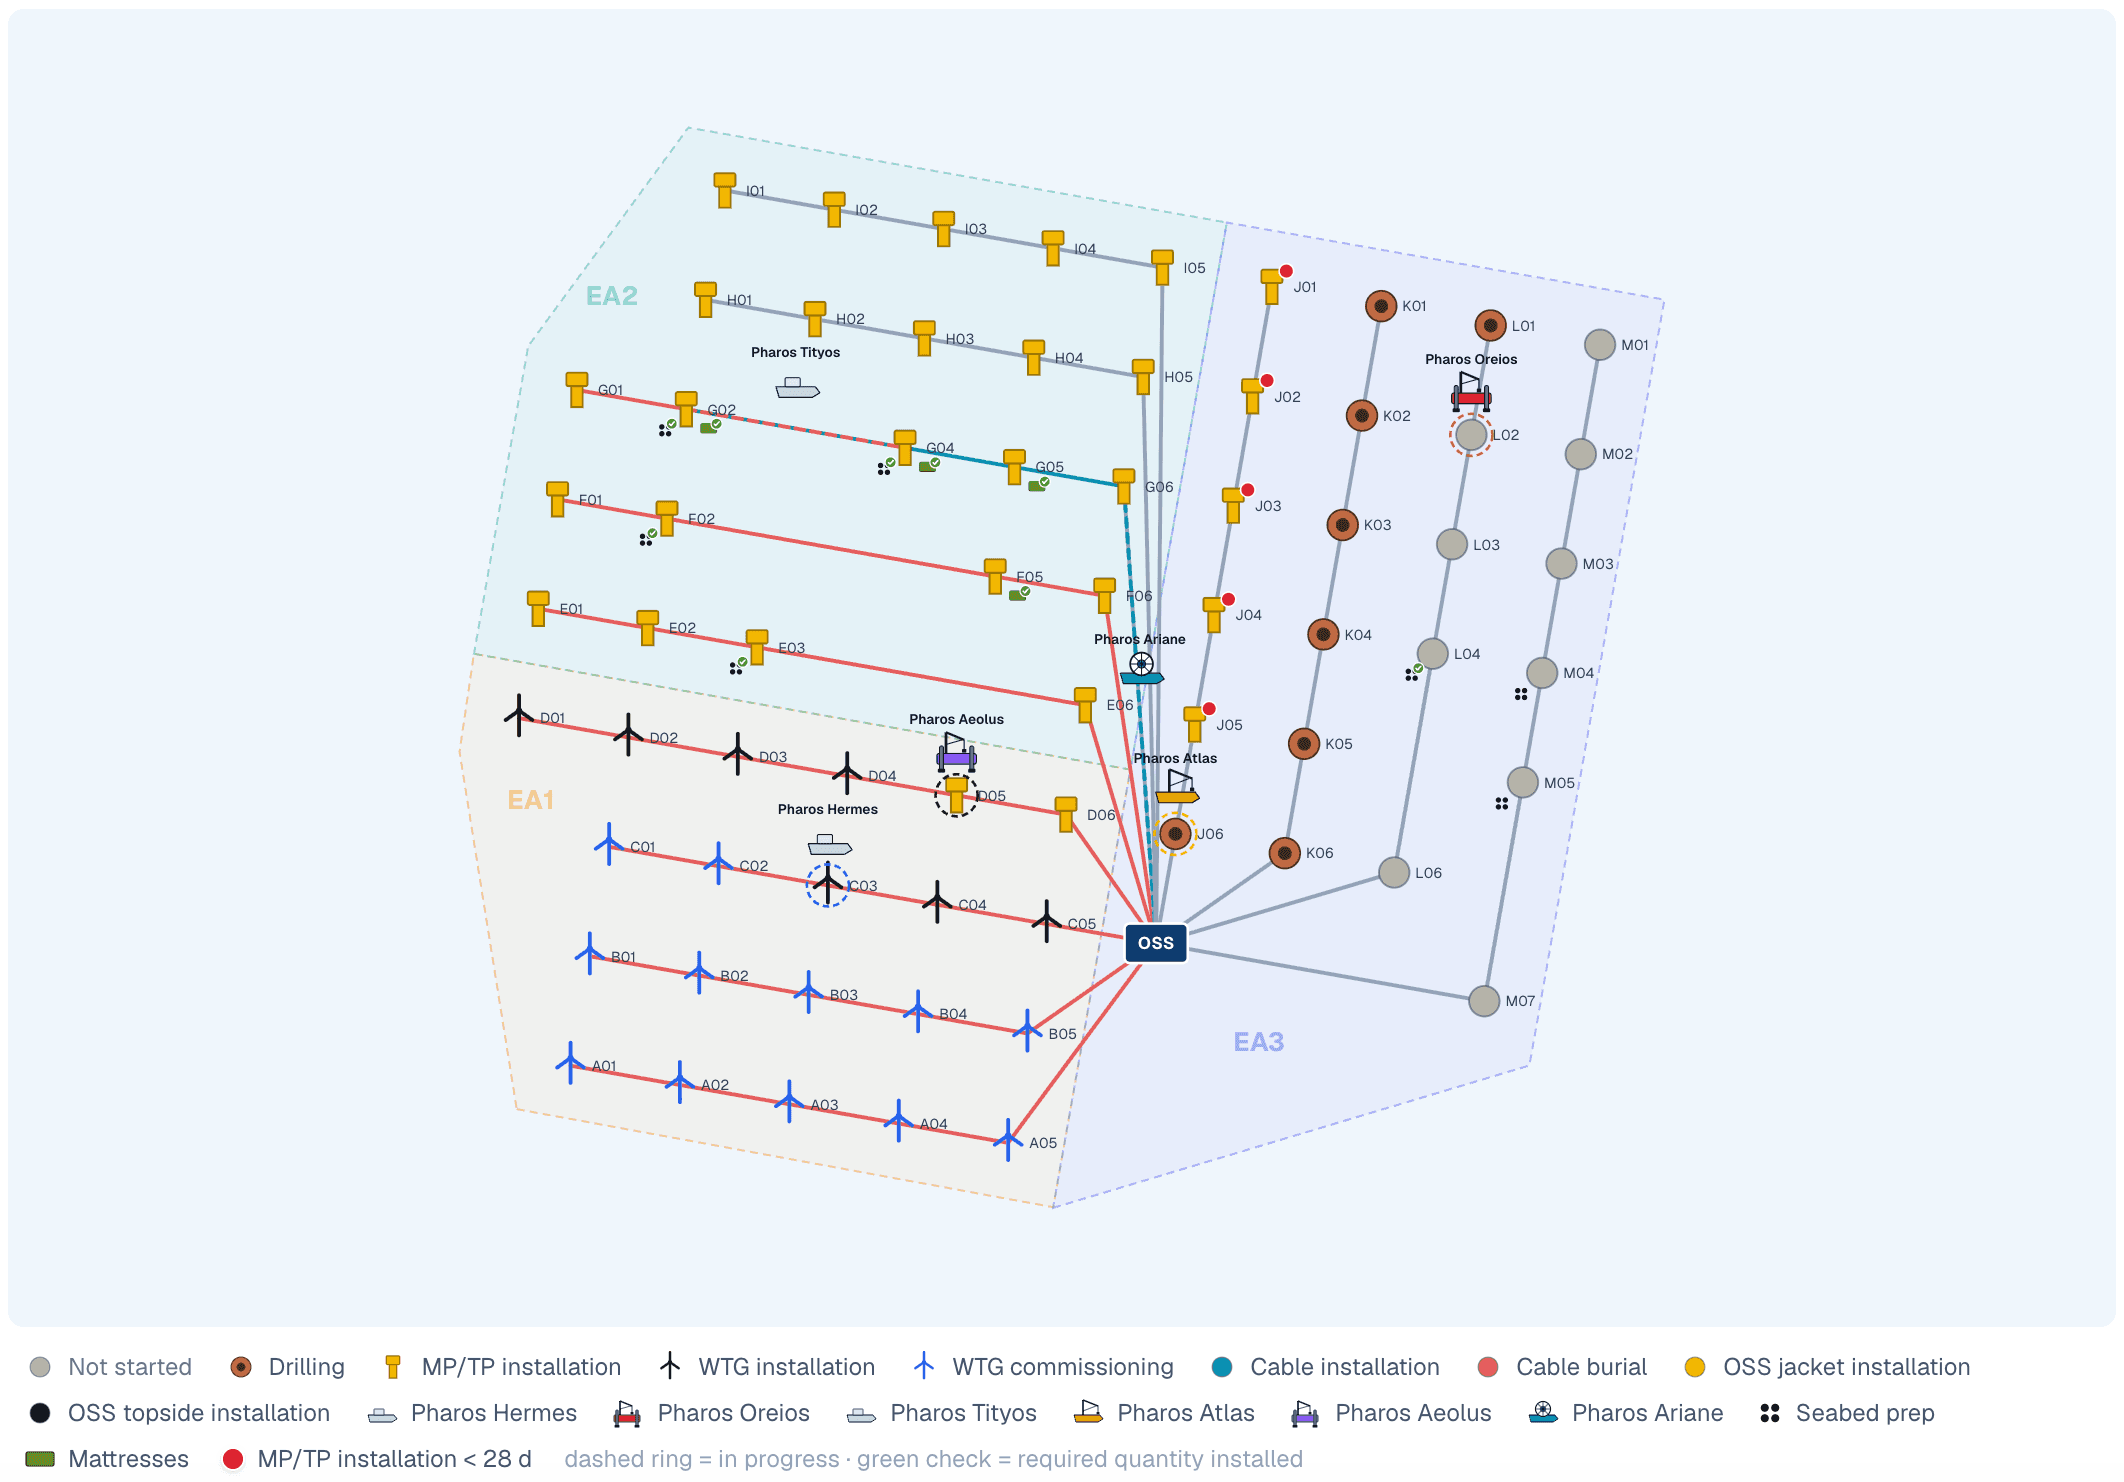
The whole field, in one glance
An interactive map of every position — foundations, turbines, offshore substation and cables — colour-coded by real progress and updated live as the team records work. Zoom into a zone, read a turbine's status, or rewind the map to any past date.
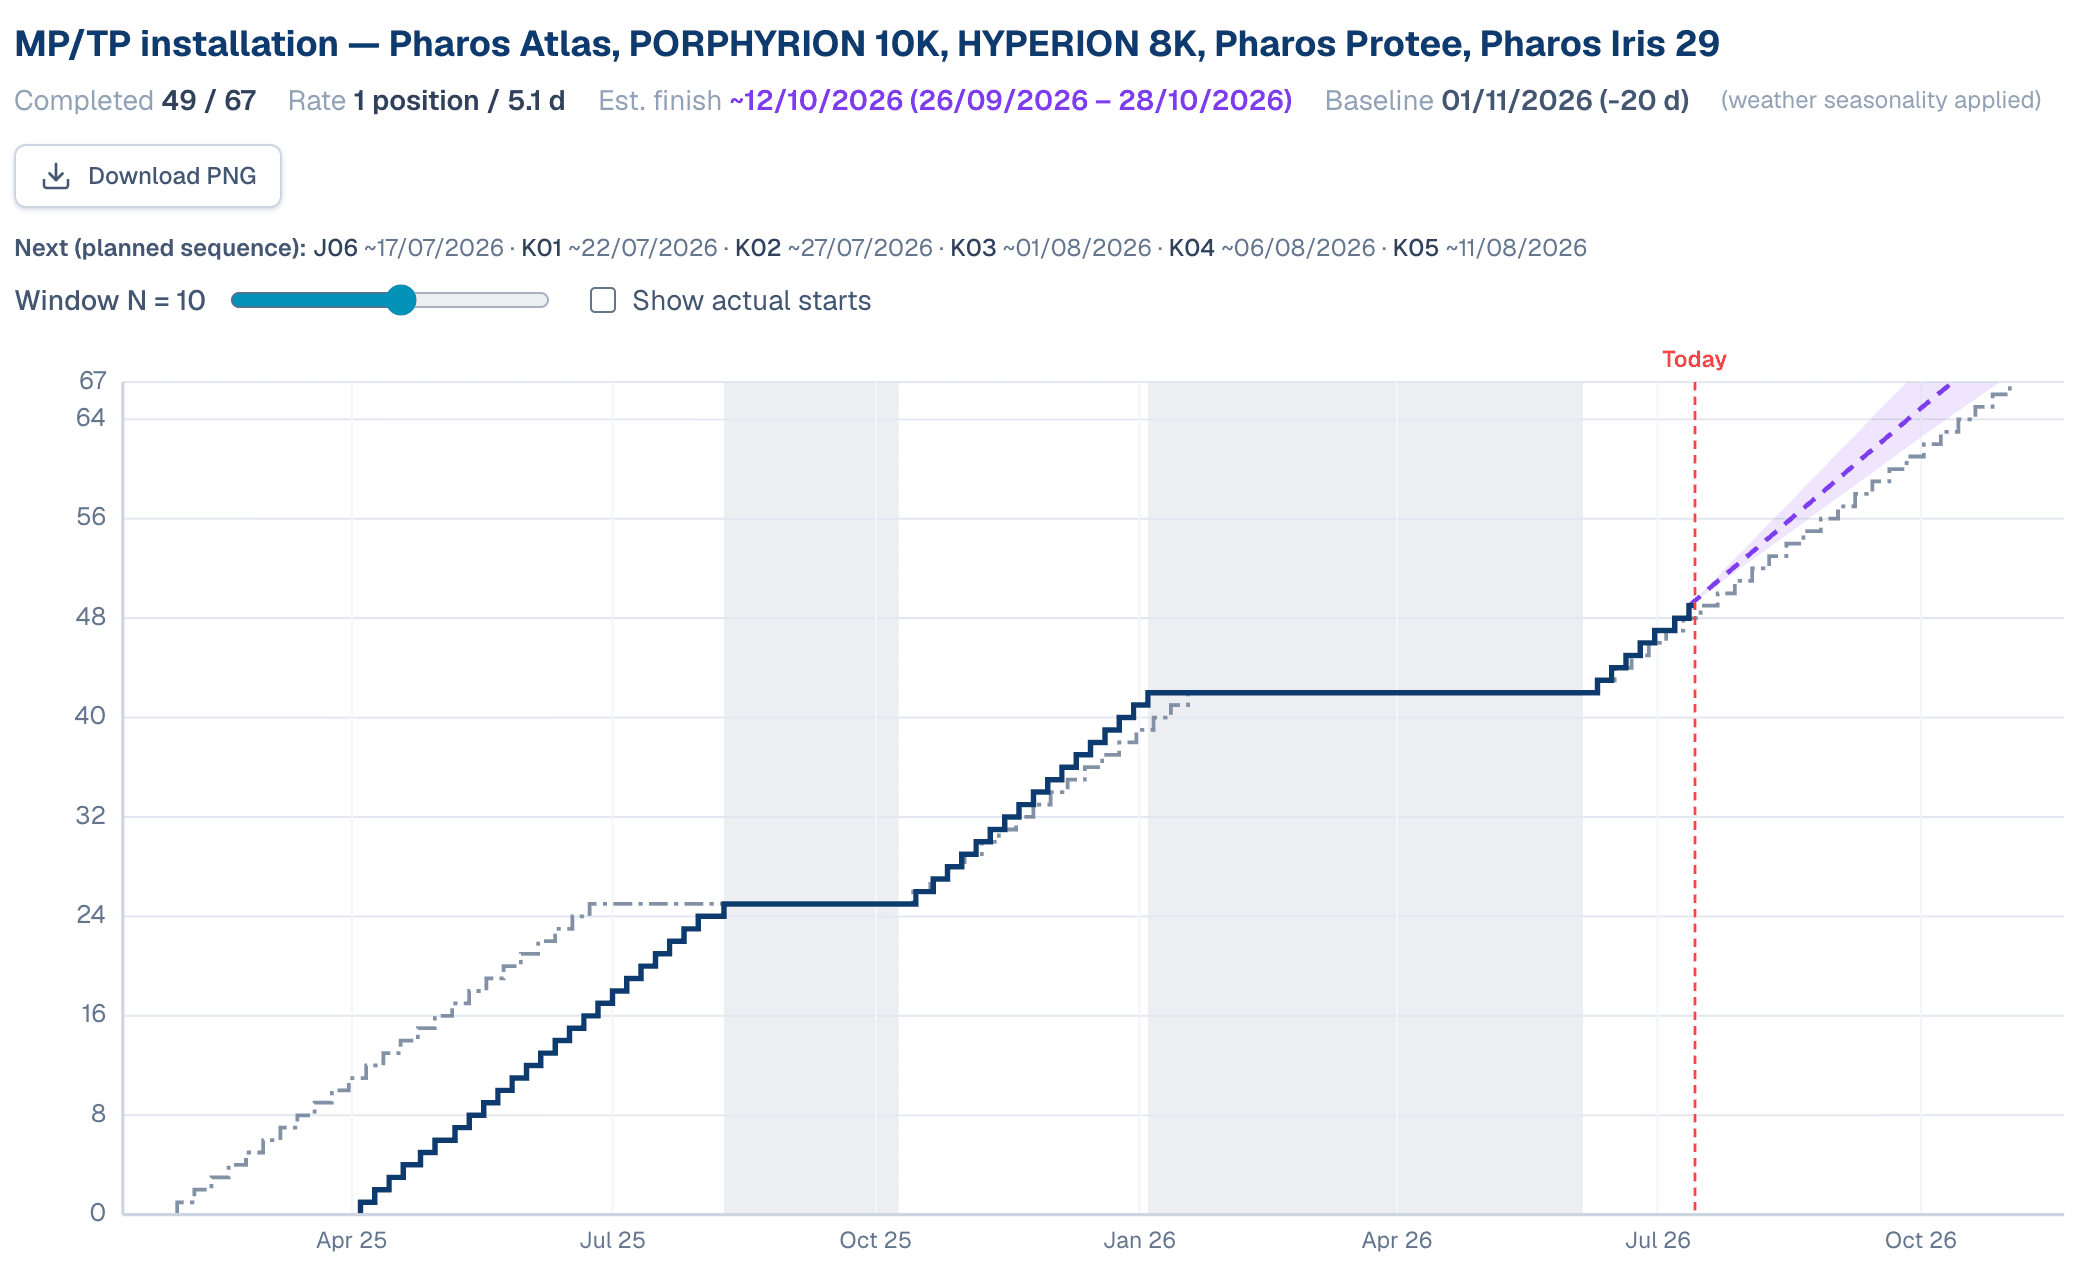
Forecasts you can stand behind
Progress curves don't just show where you are — they project where you're heading, factoring in weather seasonality, vessel availability and the real sequence of operations. You get a projected finish per campaign and per zone, with a realistic range rather than a single optimistic line.
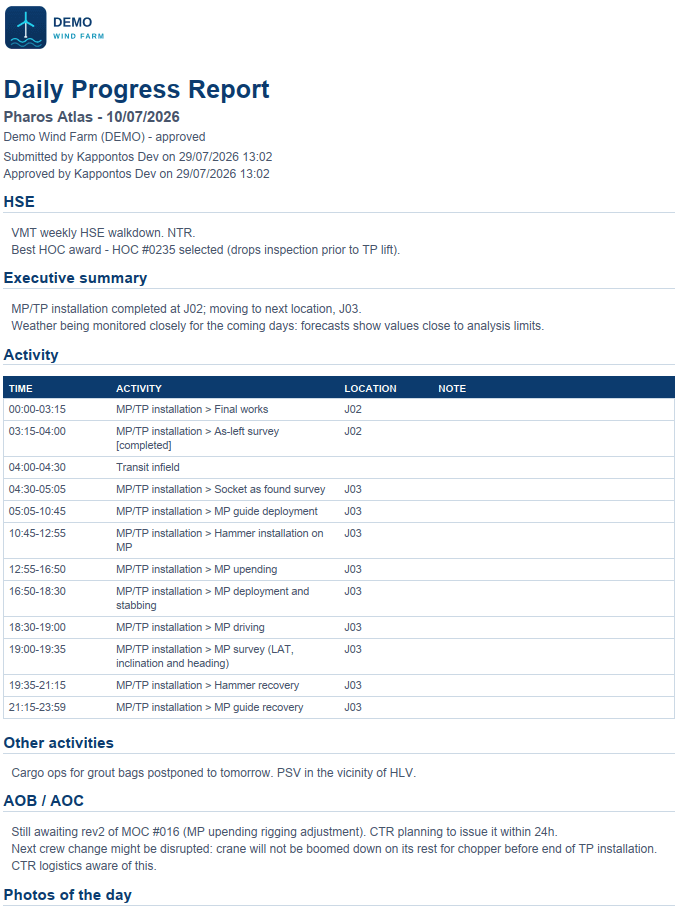
Daily reports, straight from the vessel
Each vessel's representative fills a structured daily report — an hour-by-hour timeline of operations, HSE notes and photos of the day. Once approved, the report feeds the map and the curves automatically, and a clean PDF goes out to the distribution list. No re-typing, no parallel spreadsheets.
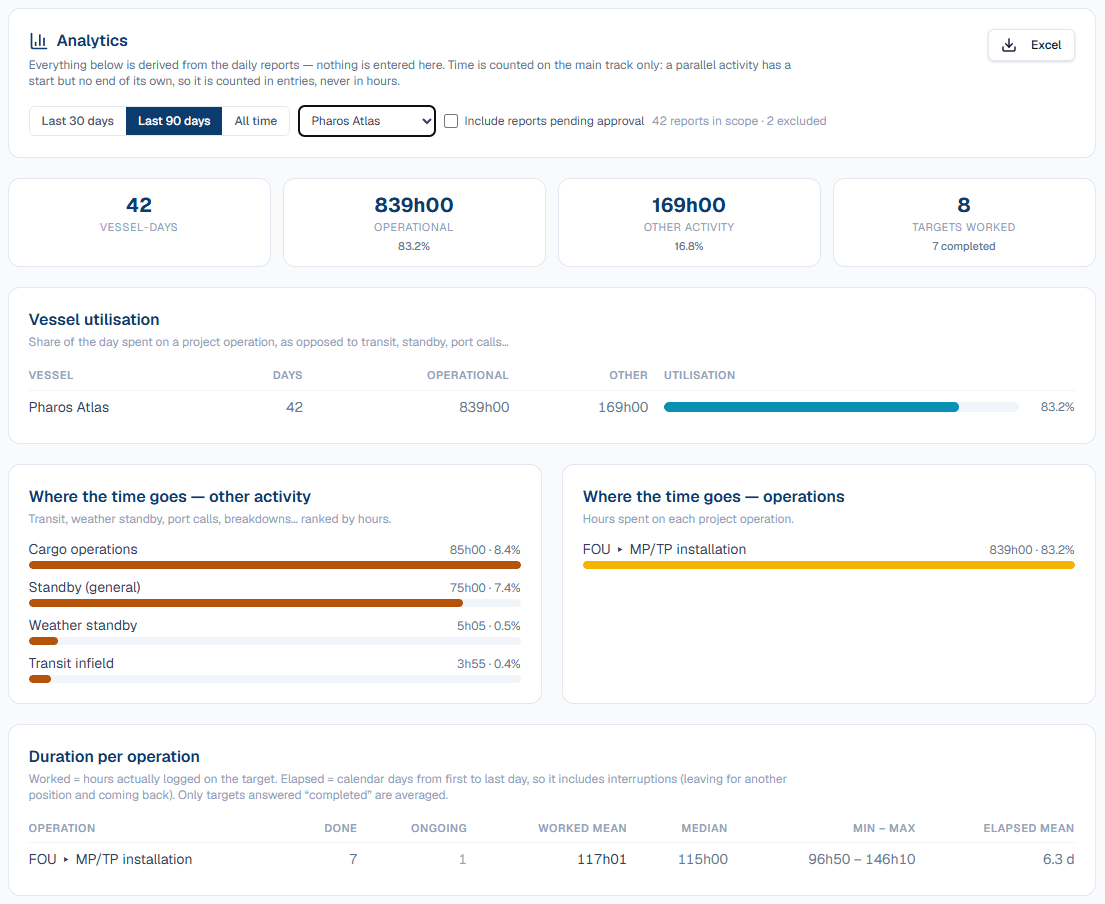
Where the time really goes
Every approved daily report becomes analytics — nothing is entered twice. Vessel utilisation, weather standby and cargo hours, duration per operation with worked versus elapsed time: the numbers your lessons-learned and rate discussions have been missing, one Excel click away.
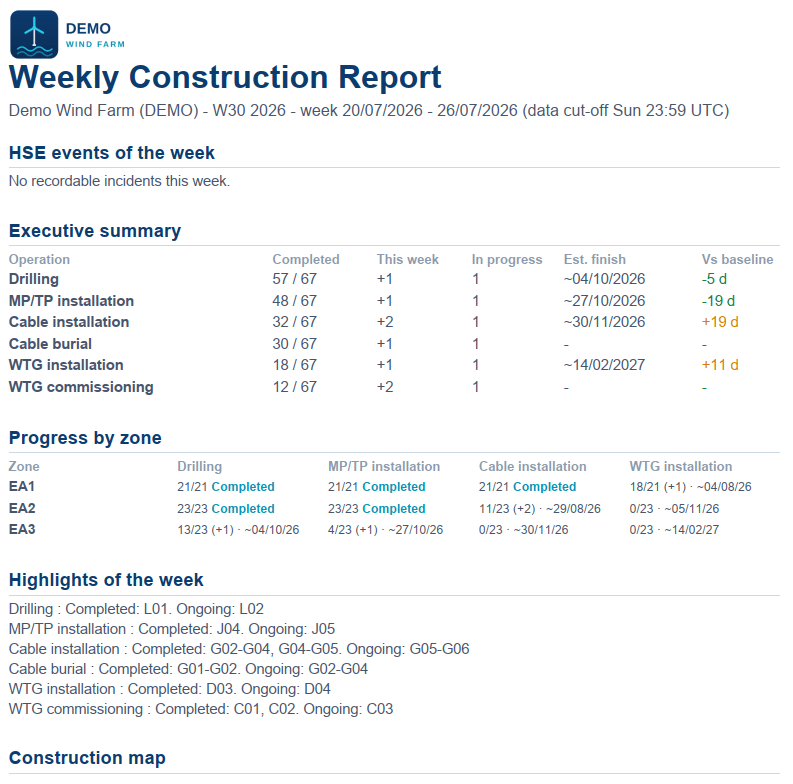
The weekly client report, in minutes
Every week Pharos drafts the construction report for you — progress, highlights, map and curves included. Review, adjust, and send a clean branded PDF to your distribution list in one click. No more evenings rebuilding slides.
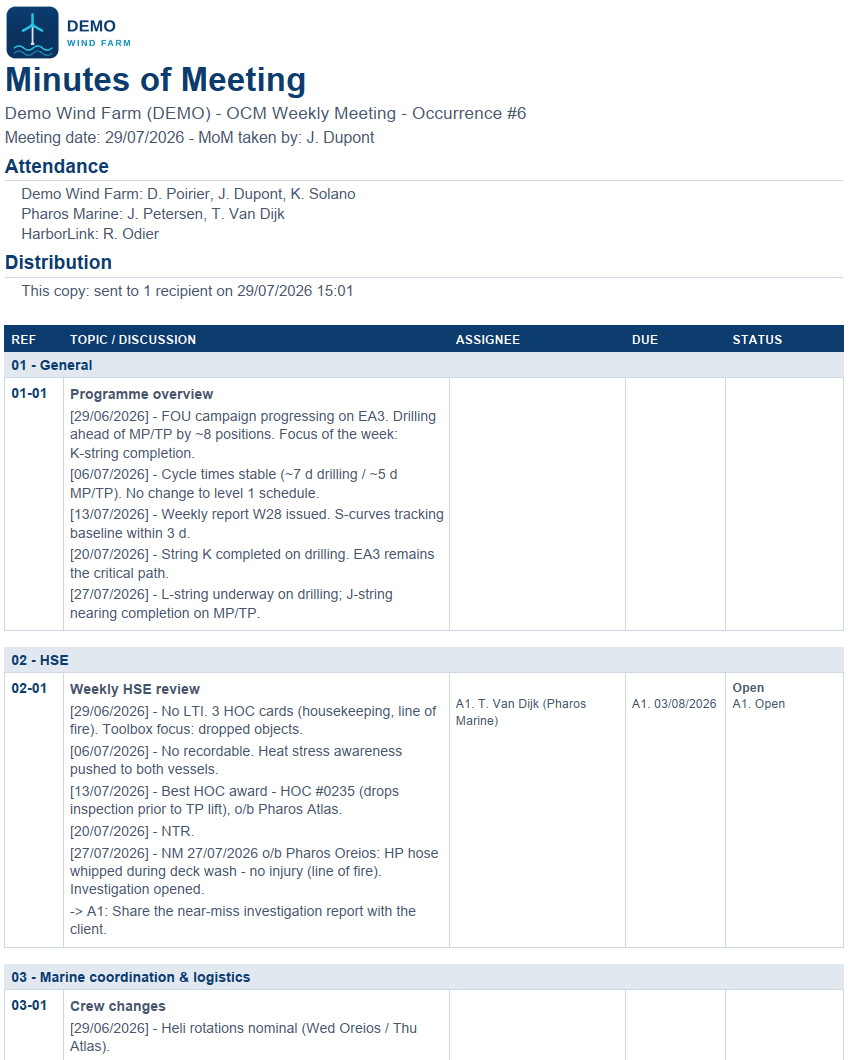
Meetings that keep their memory
Recurring minutes of meeting, the way site teams actually run them: numbered items cloned from week to week with their actions, assignees and due dates, a full trail of dated notes, and a frozen, distributable PDF once sent. The action raised in week 2 is still there — with its history — in week 12.
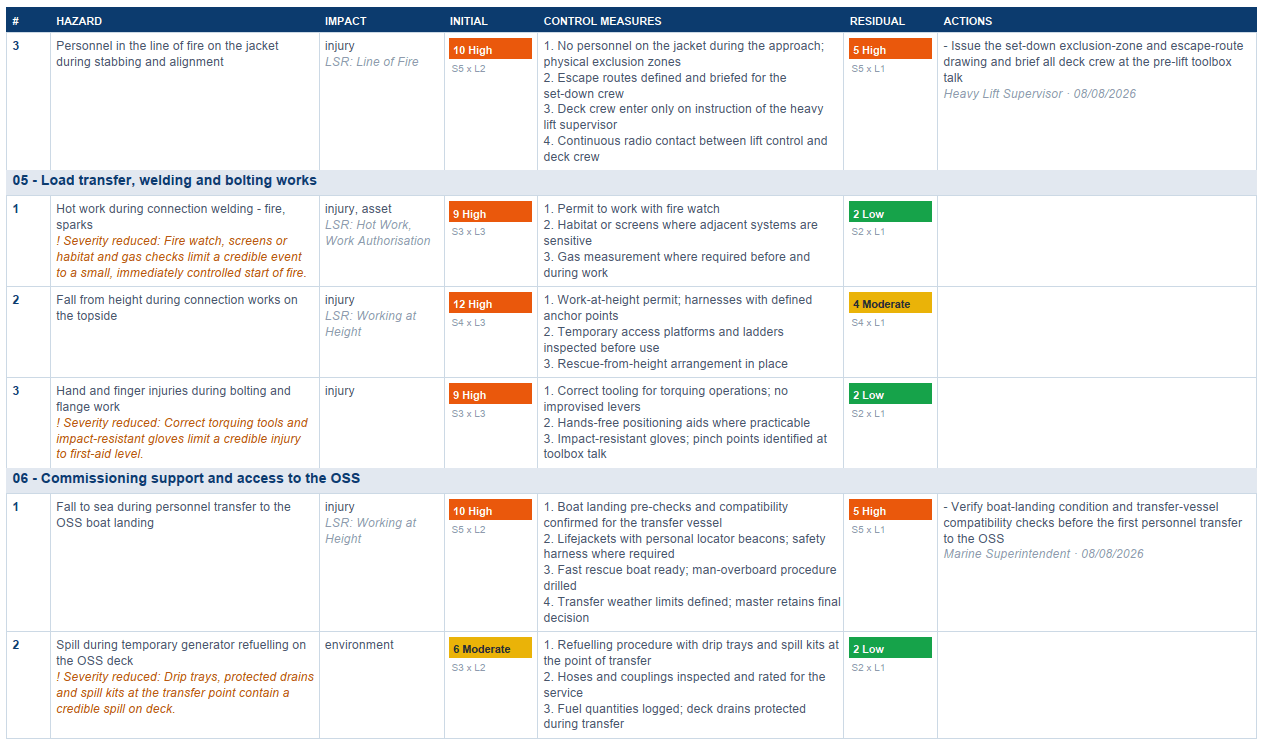
Risk assessments, from draft to close-out
Build hazard identification & risk assessments collaboratively: a configurable 5×5 matrix, initial and residual scoring with justified severity reductions, Life-Saving Rules tags, an approval workflow with locked revisions, and actions followed through to a close-out report. Sent as a memo or as the landscape table your reviewers expect.
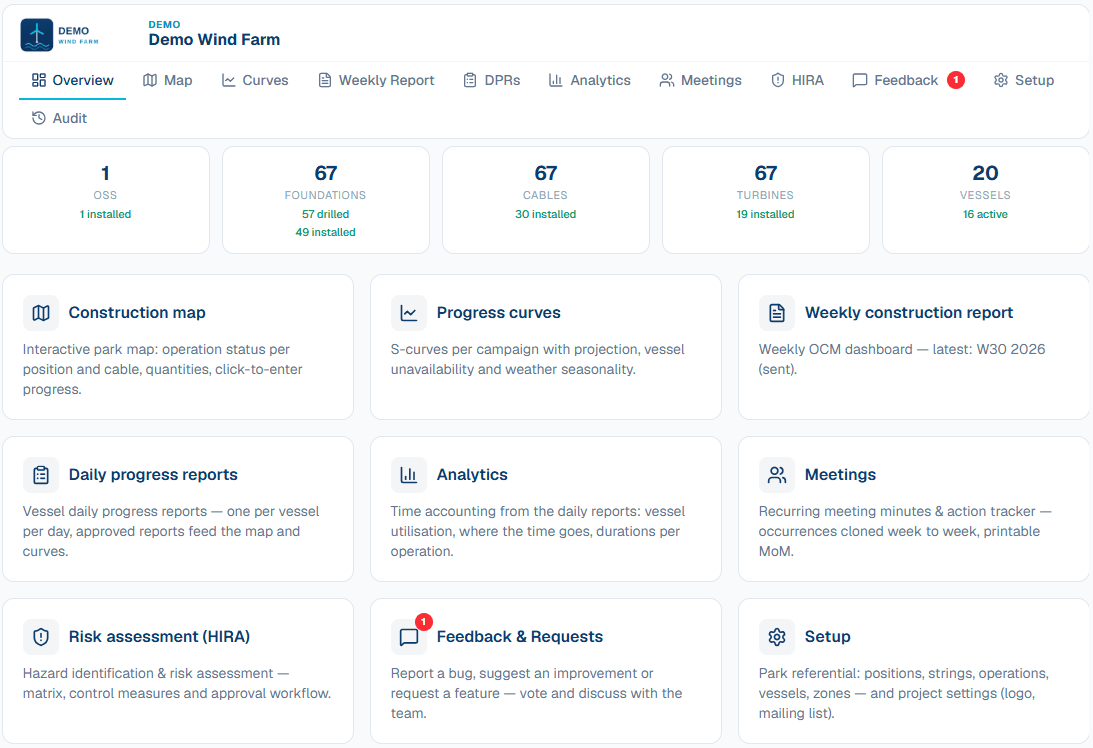
One source of truth, shared
Give every stakeholder the right level of access — from read-only client windows to editors recording daily progress. Everyone sees the same live data, on desktop or phone, with a full history of who changed what — and each project activates only the modules it uses.
And a lot more under the hood
Progress & report imports
Paste a spreadsheet, or let the assistant read a daily report and pre-fill the dates.
Automatic alerts
Get warned when a projection slips or a weather window closes in.
Snapshots & audit trail
Every change tracked, with one-click roll-back to any recent day.
Photos of the week
Attach site pictures straight into the weekly report.
Feedback & requests
Stakeholders raise questions and track them inside the app.
Exports anytime
Map, curves and data to PNG, Excel or PDF whenever you need them.
Want to see Pharos on your project?
We'll walk you through it on a live demo and discuss how it fits your construction campaign.
Get in touchPharos™ — a solution by Kappontos